
Trading commodity futures and options involves substantial risk of loss and is not suitable for all investors. You should carefully consider whether trading is suitable for you in light of your circumstances, knowledge and financial resources.
By: Rick Alexander, senior broker at Zaner Group.
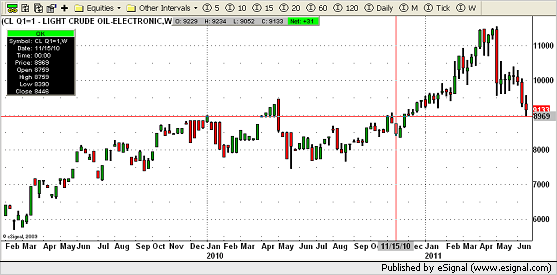
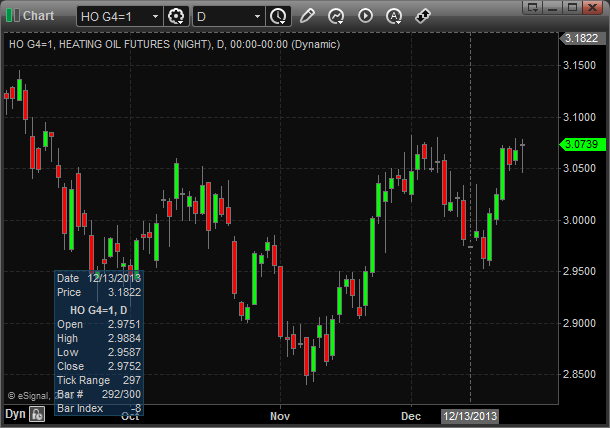
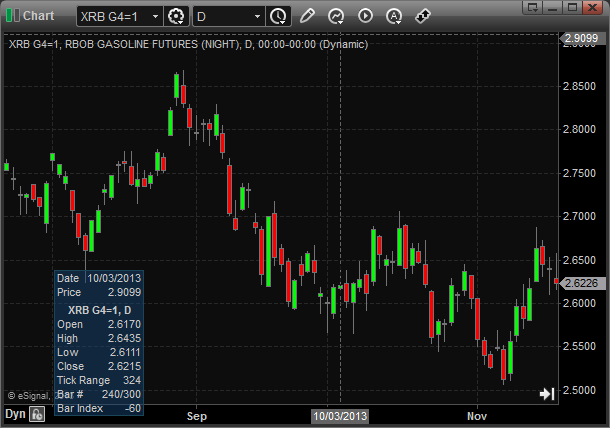
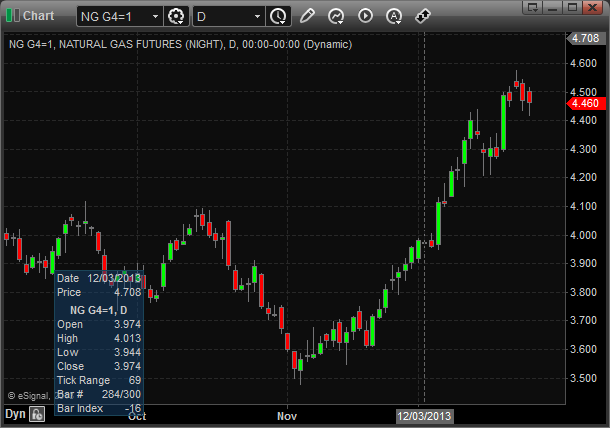
ENERGIES: 5/16/12 EIA ENERGY STOCKS. Higher closes yesterday for the heating oil and natural gas futures while lower for crude oil along with gasoline rbob. The rising dollar and falling indices lately have helped lead the energies lower. The crude made its worst low since November and close since December while the heat had its lowest low since the beginning of January before settling higher in reversal type action. The rbob had its lowest close since late January. The crude has been bascially falling since the beginning of the year and now has quite a bit of resistance overhead as shown below. It’s next support is below 9000 basis the July contract. Heating oil looks terrible but if it can hold the 2900 area there is hope for a rally up to around 3000. The rbob also needs to hold the 2900 area for a potential retracement up to 3100. Both continue to look bearish with little resistance above. Basis the weekly chart, there’s good support down to 280 basis for the June heat contract which is an awfully long way to go! The rbob, like the heat, remains in a strong down-trend at this time. The rbob has good support at 290 and from 280 down to 260. Natural gas settled higher still in its best retracement rally in quite some time. I feel the June contract needs to close over 260 since there is some resistance leading up to that price. Meanwhile, gas has been trending lower since April 2008 and has a four year supply in storage with little storage capacity left at this time. For additional customizable charts and quotes visit Markethead.com for a FREE, no-obligation 30 day subscription. SELL SIGNALS FOR CRUDE OIL AND HEATING OIL ALONG WITH GASOLINE RBOB AND NATURAL GAS FUTURES. CALL FOR DETAILS AT (312) 277-0107 OR EMAIL ralexander@zaner.com!

Rick Alexander
(312) 277-0107
Subscribe FREE to Zaner Group’s Daily Research Newsletter.
Futures, options and forex trading is speculative in nature and involves substantial risk of loss. All known news and events have already been factored into the price of the underlying commodities discussed.
- Judy Crawford’s Energy futures Market Update (5/16)
- Rick Alexander’s Energy futures commentary (5/15)
- Heating Oil & Gasoline RBOB show sell signals (5/14)
- USDA Crop Report Quick View (5/10)
- Judy Crawford’s Grain futures Market Update (5/16)
- Metal complex tumbles, Gold futures generate a sell signal (5/11)
- Judy Crawford’s S&P 500 futures Market Update (5/16)
- Rick Alexander’s Grain futures commentary (5/16)
- Live Cattle & Feeder Cattle futures give buy signals (5/15)
- Rick Alexander’s Grain futures commentary (5/16)
- Judy Crawford’s Metal futures Market Update (5/16)
- Rick Alexander’s Stock Index futures commentary (5/16)
- Markethead: Quotes, charts, news, commentary and more.


Rick Alexander’s Energy futures commentary (5/18)
Trading commodity futures and options involves substantial risk of loss and is not suitable for all investors. You should carefully consider whether trading is suitable for you in light of your circumstances, knowledge and financial resources.
By: Rick Alexander, senior broker at Zaner Group.
ENERGIES: 5/18/12 Lower closes yesterday for crude oil and heating oil futures along with gasoline rbob and natural gas futures. The rising dollar and falling indices lately have helped lead the energies lower. The crude made its worst close since November 2nd while the heat had its lowest low and close since December and the rbob since January. The crude has been bascially falling since the beginning of the year and now has quite a bit of resistance overhead as seen below. It’s next support is below 9000 basis the July contract. Heating oil looks terrible unable to hold the 2900 area but with little resistance up to around 3000 making ot scary to go short at its present level. The rbob also has little resistance up to 3100 while ending up below 29000 also. Both continue to look bearish with little resistance above. Basis the weekly chart, there’s good support down to 280 basis for the June heat contract which is a long way to go but alot closer than a week ago. The rbob had good support at 290 and from 280 down to 260. Natural gas settled lower after making its best high since late March in revesal type action while having its best retracement rally in quite some time. I feel the June contract needs to close over 260 since there is some resistance leading up to that price. Meanwhile, gas has been trending lower since April 2008 and has a four year supply in storage with little storage capacity left at this time. For additional customizable charts and quotes visit Markethead.com for a FREE, no-obligation 30 day subscription. SELL SIGNALS FOR CRUDE OIL AND HEATING OIL FUTURES ALONG WITH GASOLINE RBOB AND NATURAL GAS FUTURES. CALL FOR DETAILS AT (312) 277-0107 OR EMAIL ralexander@zaner.com!
Rick Alexander
(312) 277-0107
ralexander@zaner.com
Zaner Group
Subscribe FREE to Zaner Group’s Daily Research Newsletter.
Futures, options and forex trading is speculative in nature and involves substantial risk of loss. All known news and events have already been factored into the price of the underlying commodities discussed.